 If there is one thing people should get from the markets now, it’s out
In the midst of lots of twitterbollocks about David Cameron’s bestial blow job and Brussels diktats about how many economic refugee migrant opportunist heroes we may all have to take, the steady drift downwards of all the main stock markets yesterday may well have escaped your attention.
If so, here’s the bulletpoint summary.
- All the US indexes were down an average of 1.3%
- In Japan, the figure was almost exactly 2%
- In the UK, they fell by the same 2%
- Across Europe, the dip was 3.4%
- In Germany, the number was 2.8%
- In France, it was 3.1%
- In Russia, the fall was 2.2%
- In Brazil, 3.4%
- India finished 1.8% down
- Oil prices dropped an average of 1.7%
- In the 1st half of 2015, timber prices slumped 7.3%
Bearing in mind the 16k & 6k & 3k psychological levels in the US, UK, and China, the US is still at just above 16300, the UK number has slipped to 5935, and China is at 3180. But we must remember that all three of them are being heavily supported by combinations of QE, Zirp and (in China) draconian limits on selling plus huge PBOC buying.
So how is Asia looking this morning? The answer is, red-faced; this is the story so far in China:
 Notable are the drops in the Hang Seng and Red Chips. Also the usual SSE comp and B afternoon PBOC buying spree helped by a little by too much rice wine at lunch.
A few hours behind, all four Indian markets are in the red, although early plummeting is seeing some recovery there.
In Japan, its also clear as black and white and red all over:
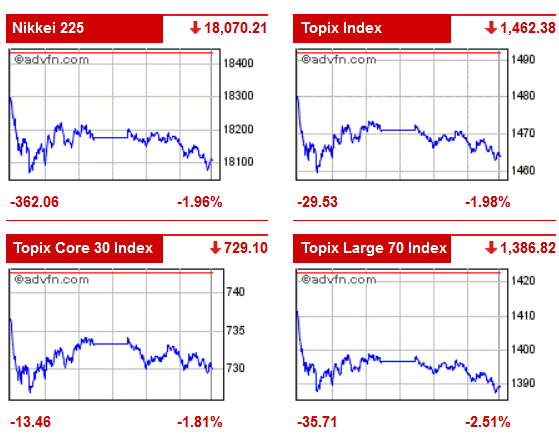 The Nikkei and all Toppix in bad shape, averaging around the 2% we saw in the West yesterday. Meanwhile, in Australia (where they seem to have ignored almost every signal of late) there’s been a heart transplant from bull to bear;
 The ASX miner is especially significant, as Australia is overwhelmingly dependent on China as the buyer of pretty much everything they dig up. Also, the Aussie analysts may perchance have spotted this rather telling chart from the UN’s World Development Indicators:
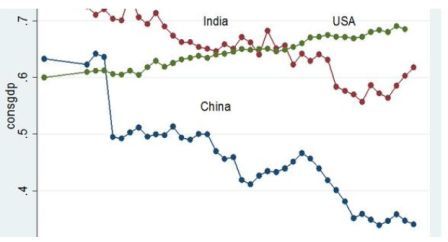 This tells us that from its peak of 6.4% share of all household consumables globally, by early summer 2015 China had slumped to 3.3%. Why some commentators see China as ‘past the worst and we shouldn’t worry’ continues to be beyond me. And since the audit above came to an end, things have worsened, not improved: the Caixin/Markit purchasing managers’ index (PMI) fell to 47 in September, below forecasts of 47.5. That makes three consecutive months of contraction. Yesterday, the Asian Development Bank lowered its growth forecast for China again.
The thing people need to wake up to here is that it’s not just Chinese volume going down in a global recession: Chinese products are losing share of market. The two factors in play here are first and most important, Beijing being undercut on price by other emerging Asian tigers; and second, the serious quality problem that surrounds almost all Chinese goods. The best medium-term way to avoid the growth buffer for China is to upgrade quality, improve innovation, and increase margins….easy to say, but hard to do when the politburo quite clearly understands neither financial markets nor market segmentation.
In three years flat, China has done what the US has been doing since 2003: produce false confidence from financialised growth. All around the world now, that scam is being found out bigtime. The charge on this one is being led by commodities: a survey of 13 investment banks by The Wall Street Journal showed their average expectations for Brent crude to be off by $9 to $58.70 a barrel compared with last month. For West Texas Intermediate, the U.S. oil marker, the average forecast is for $54.40 a barrel, also down $9 from August. Just to remind all of us how catastrophic the oil price collapse has been, this is the graph that counts:
From a peak of $105 in June 2014, the price has more than halved, and the most optimistic of forecasters interviewed by the WSJ did not see it rising above $60 in 2016.
Now fine, some of this is OPEC’s price war with the US fracking industry (which, while based on greed, is doing us all a favour ecologically) but as time goes on, more and more of the volume is simply falling demand. China’s consumption of oil by-product plastic is astronomical: to suggest in the context of Chinese’s share of consumer goods halving that the drop is largely manipulation seems to me a nonsense.
Looked at another, equally gloomy way, I’m not aware of any geopolitical war going on in the timber business. But this is what it’s done since August 2014:
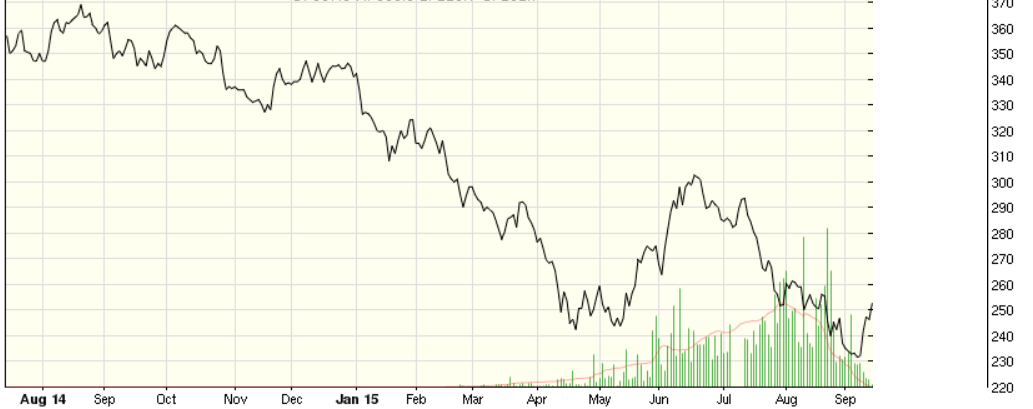 A rally in the early summer of 2015 has been reversed. No market is mutually exclusive from another: builders see disappointing data and put off speculative materials purchases. This is called the Free Market system. Allegedly. The third key commodity to watch is copper. This shows more clearly how the ‘growth’ of the last five years has been a financialisation con:
 In a western Anglo-Saxon world that allegedly saw 20% ‘nominal’ growth from 2010-15, copper (the most industrially ubiquitous solid material on the plant) slumped from $4.5 to $2.5 a lb. Stick that one up a blind neoliberal’s nose, see how he reacts. Hours of fun for all the family.
Here is one very simple fact I posted last week: ‘Spookily enough, both the UK and US are showing nominal growth in the seven years since 2008 at 20%….the exact amount of assets (ie, junk) purchased over that time. But during that same period, wage levels have been eroded in real terms by circa 9%….hence the lack of any of the recovery symptoms one would expect to see: people are worse off, and growth is little more than stimulation’.
The biggest confidence trick of all about QE is that central banks include it in their calculations of economic activity. The spend of asset buying is 20% of GDP, and GDP growth is 20%. Well I never. That’s not an exact mathematical comparison, but it is a telling correlation.
Neoliberal Global Greed Monopolism is a flawed rationalisation in which the gap between economic reality and financial hubris is getting wider every month. Another correction is on the way. After that there’ll be another one. And then another one.
Related in a recent Slogpost: The steady slide down the slippery slope
